Imperial Cardiac Atlas
A bi-ventricular cardiac atlas was created from high-resolution MR images of 1093 healthy subjects, which is part of the UK Digital Heart Project. The atlas describes the anatomical structures of an average normal heart at end-diastole (ED) and end-systole (ES). The atlas data includes template images, template label maps, probabilistic label maps and template surface meshes at ED and ES and a AHA 17-segment model at ED. We have also computed a statistical shape model based on the surface meshes of all the hearts.
The probabilistic label maps are stored as a 4D image, where the fourth dimension denotes the number of tissue classes. We have four tissue classes with the labels: 0=background, 1=LV cavity, 2=LV myocardium, 4=RV cavity.

(a) Template at ED.

(b) Label map at ED.

(c) Probability map at ED.
(d) Surface mesh at ED.

(e) Template at ES.

(f) Label map at ES.

(g) Probability map at ES.
(h) Surface mesh at ES.
(i) Template as a sequence.
Download links
The atlas data can be downloaded from Google Drive, which is publicly accessible.
The statistical shape model can be downloaded from the Digital Heart github repository.
Tools for using the atlas
The software package irtk (binaries, source code) is used for viewing the atlas and aligning a new image to the atlas.
Alignment to the template
The template image can be used for spatial normalisation of cardiac images, so that they are represented in the same template space. To align a given cardiac image with the atlas, six landmarks are used for initial alignment, followed by refinement using affine image registration and non-rigid image registration.
Placing the landmarks
To place the landmarks used for initial alignment, open the cardiac MR image using rview. go to the Landmarks tab on the right hand side panel, press the Add button to place the landmarks. The six landmarks that I use are:
- Mid-ventricular slice, RV insertion point (next to the liver)
- Mid-ventricular slice, a point on the RV free wall
- Mid-ventricular slice, RV insertion point (next to the lung)
- Mid-ventricular slice, a point on the LV free wall
- Apical slice, apex
- Basal slice, centre of the base
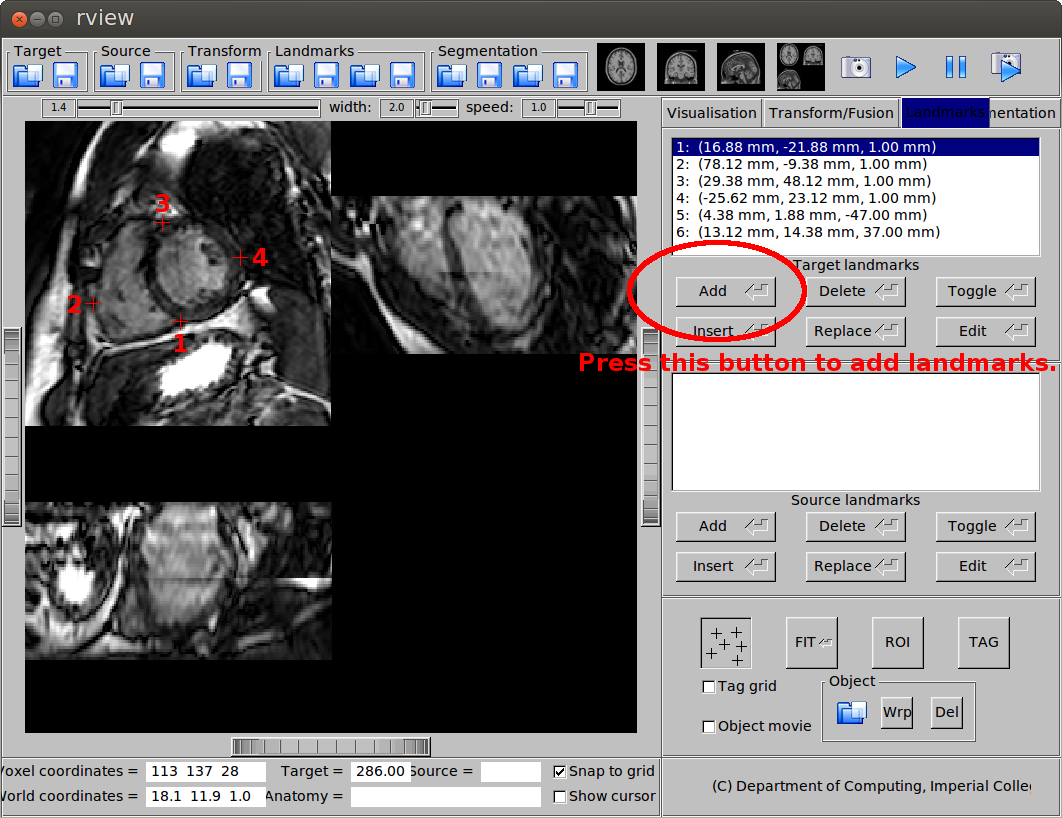
(a) Landmarks on the mid-ventricular slice.
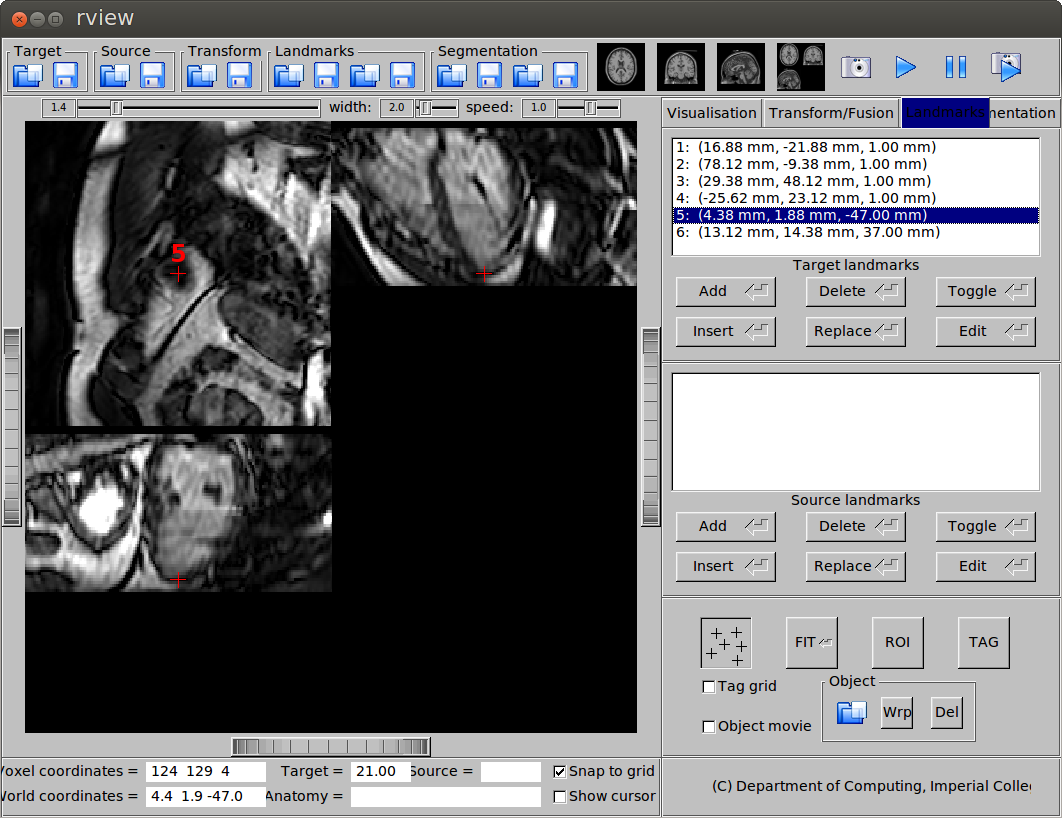
(b) Landmark at the apex.
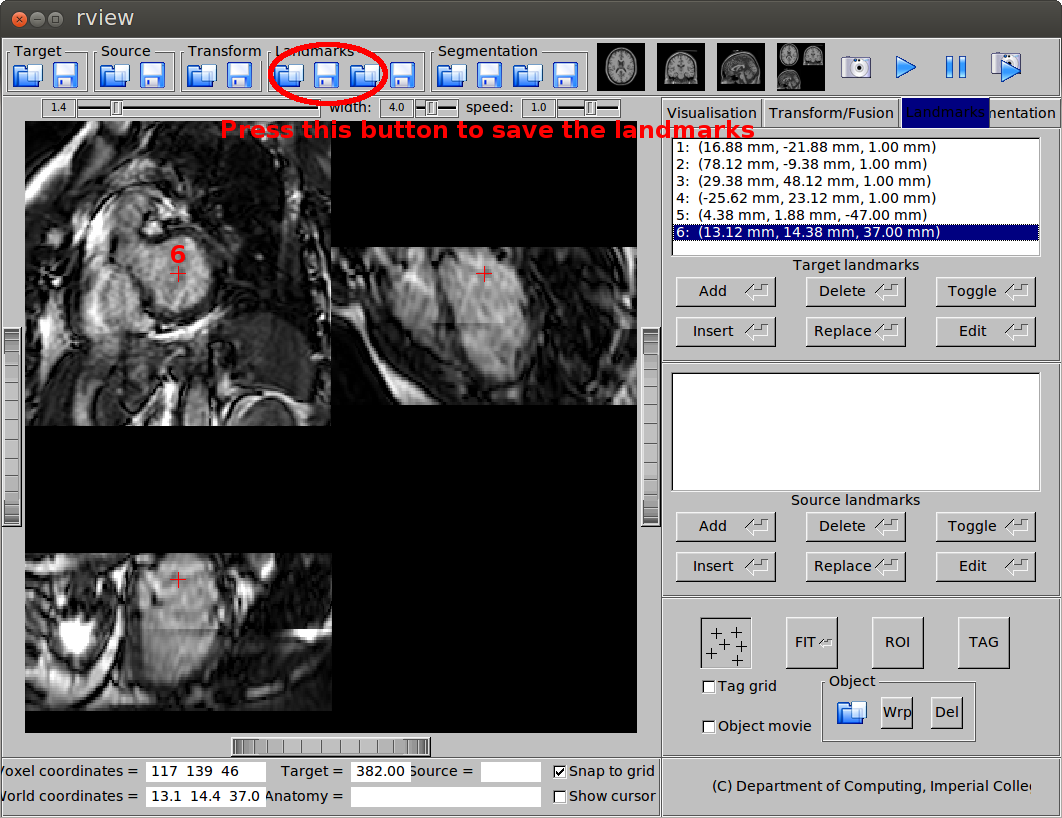
(c) Landmark at the base.
The mid-ventricular slice is normally the slice that rview will automatically display after you load the image. To move to the apical and basal slices, you need to scroll or click you mouse. After you pick the landmarks, save the landmarks in vtk format.
The reason that we use six landmarks is that the image orientation in cardiac MR can be very flexible so alignment may not be easy. We have found that using six landmarks provides us a robust way to start the alignment and more accurate image-based registration can then be used to refine this initial alignment. The six landmarks only need to be placed at the ED phase and it takes about 15 to 30 seconds depending on proficiency. So it is not too much manual work, hopefully. Recently, we have also developed an automatic method for landmark detection and we are currently experimenting with the method and evaluating its performance.
Landmark registration
Landmark registration is performed for initial alignment between the subject image and the template image. In landmark registration, the distance between landmarks is minimised with regard to a transformation such as rigid or affine transformation. The command prreg is used:
prreg $subject/landmarks_ED.vtk $template/landmarks_ED.vtk -dofout prreg.dof.gz
where $subject and $template refers to the directory of the subject image and the template image. From image registration perspective, they are also called target image and source image.
Image registration
Image registration is a process which minimises some kind of cost function between two images with regard to a transformation. The cost function normally consists a data term (e.g. sum of squared difference (SSD), normalised mutual information (NMI)) and a regularisation term (e.g. bending energy, volume preservation constraint). Based on the initial landmark registration result, we perform affine image registration using areg and then non-rigid image registration using nreg:
areg $subject/image_ED.nii.gz $template/template_ED.nii.gz -parin areg.par -dofin prreg.dof.gz -dofout areg.dof.gz

nreg $subject/image_ED.nii.gz $template/template_ED.nii.gz -parin nreg.par -dofin areg.dof.gz -dofout nreg.dof.gz
where areg.par and nreg.par are affine registration parameter file and non-rigid registration parameter file. The irtk website explains how to set the parameters.
Template transformation
So now we have established the transformation from the subject image to the template image, which is stored in the file nreg.dof.gz. We can use this information to transform the template image, probability map and surface mesh onto the subject space. The commands transformation and ptransformation are respectively used for transforming images (nifti files) and meshes (vtk files):
transformation $template/template_ED.nii.gz fitted_template_in_subject_space.nii.gz -linear -dofin nreg.dof.gz -target $subject/image.nii.gz

transformation $template/probability_ED.nii.gz fitted_prob_map_in_subject_space.nii.gz -linear -dofin nreg.dof.gz -target $subject/image.nii.gz

ptransformation $template/heart_ED.vtk fitted_heart_mesh.vtk -dofin nreg.dof.gz -invert
The graphical user interface rview can be used to view the transformed images and meshes. To view an image (nifti format), simply load it as either target or source image using the button at the top-left corner. To view a mesh (vtk format), go to the Landmarks tab and use the Object button at the bottom. You can load both an image and a mesh, so that they are overlaid on display, as shown in this figure:
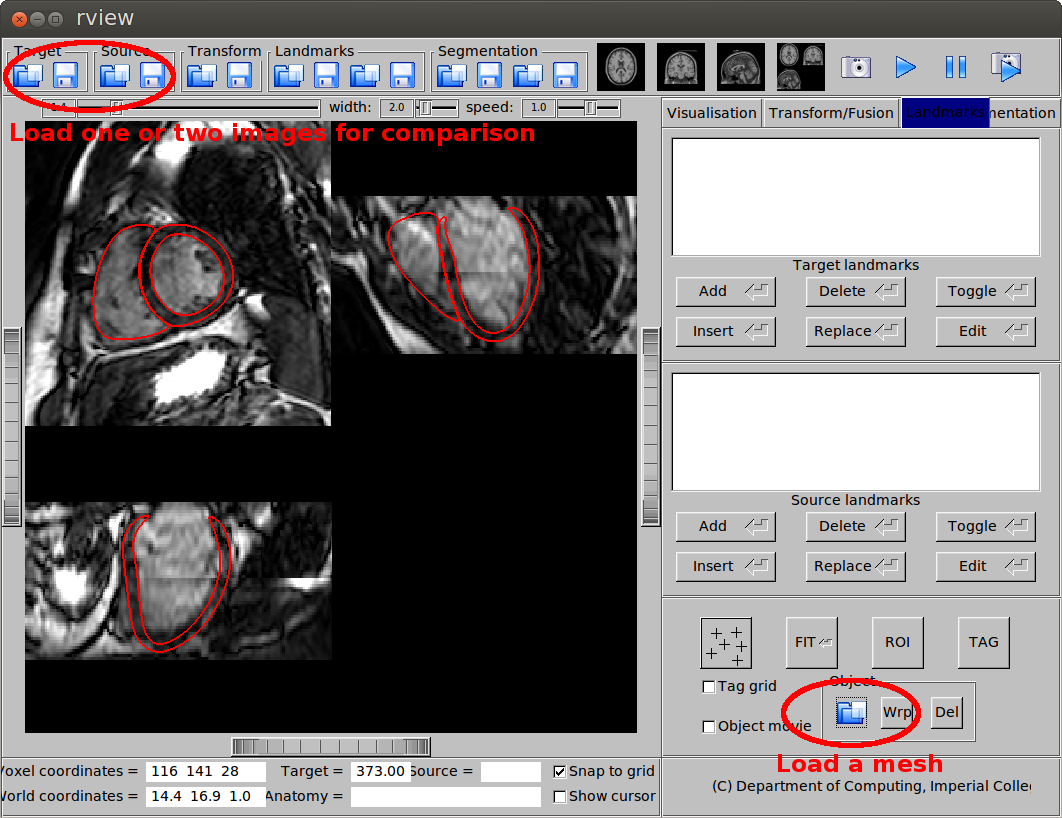
Overlay of an image and a mesh.
AHA 17-segment model
An AHA 17-segment model (an image and a mesh) is provided in the atlas data, as shown in this figure. The image and the mesh can be view using rview. Alternatively, the mesh can also be used using Paraview.

(a) The AHA 17-segment model as an image.
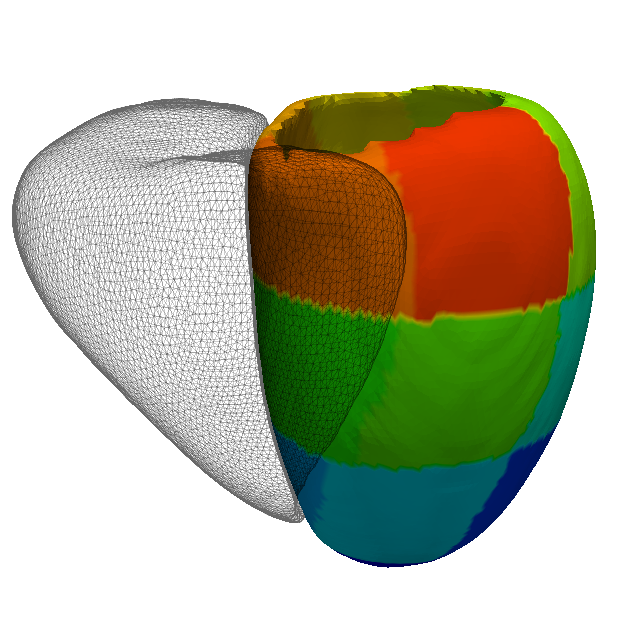
(b) The AHA 17-segment model as a mesh.
The model is generated by manually parcellating the left ventricle in the template label map at ED, according to the anatomical criteria described in this paper:
- Cerqueira, M. D., Weissman, N. J., Dilsizian, V., Jacobs, A. K., Kaul, S., Laskey, W. K., Pennell, D. J., Rumberger, J. A., Ryan, T., Verani, M. S., et al., 2002. Standardized myocardial segmentation and nomenclature for tomographic imaging of the heart. Circulation 105 (4), 539-542.
You can transform the AHA 17-segment model onto the subject space using transformation or ptransformation as previously described.
Potential applications
We hope that this cardiac atlas can be useful for you, such as using the probability maps for Bayesian segmentation or using the template space for atlas-based analysis.
Reference
If you use the atlas for publication, we would be very grateful if you could cite the following paper which describes the methodology and data for constructing the atlas:
- W. Bai, W. Shi, A. de Marvao, T.J.W. Dawes, D.P. O’Regan, S.A. Cook, D. Rueckert. A bi-ventricular cardiac atlas built from 1000+ high resolution MR images of healthy subjects and an analysis of shape and motion. Medical Image Analysis, 26(1):133-145, 2015.