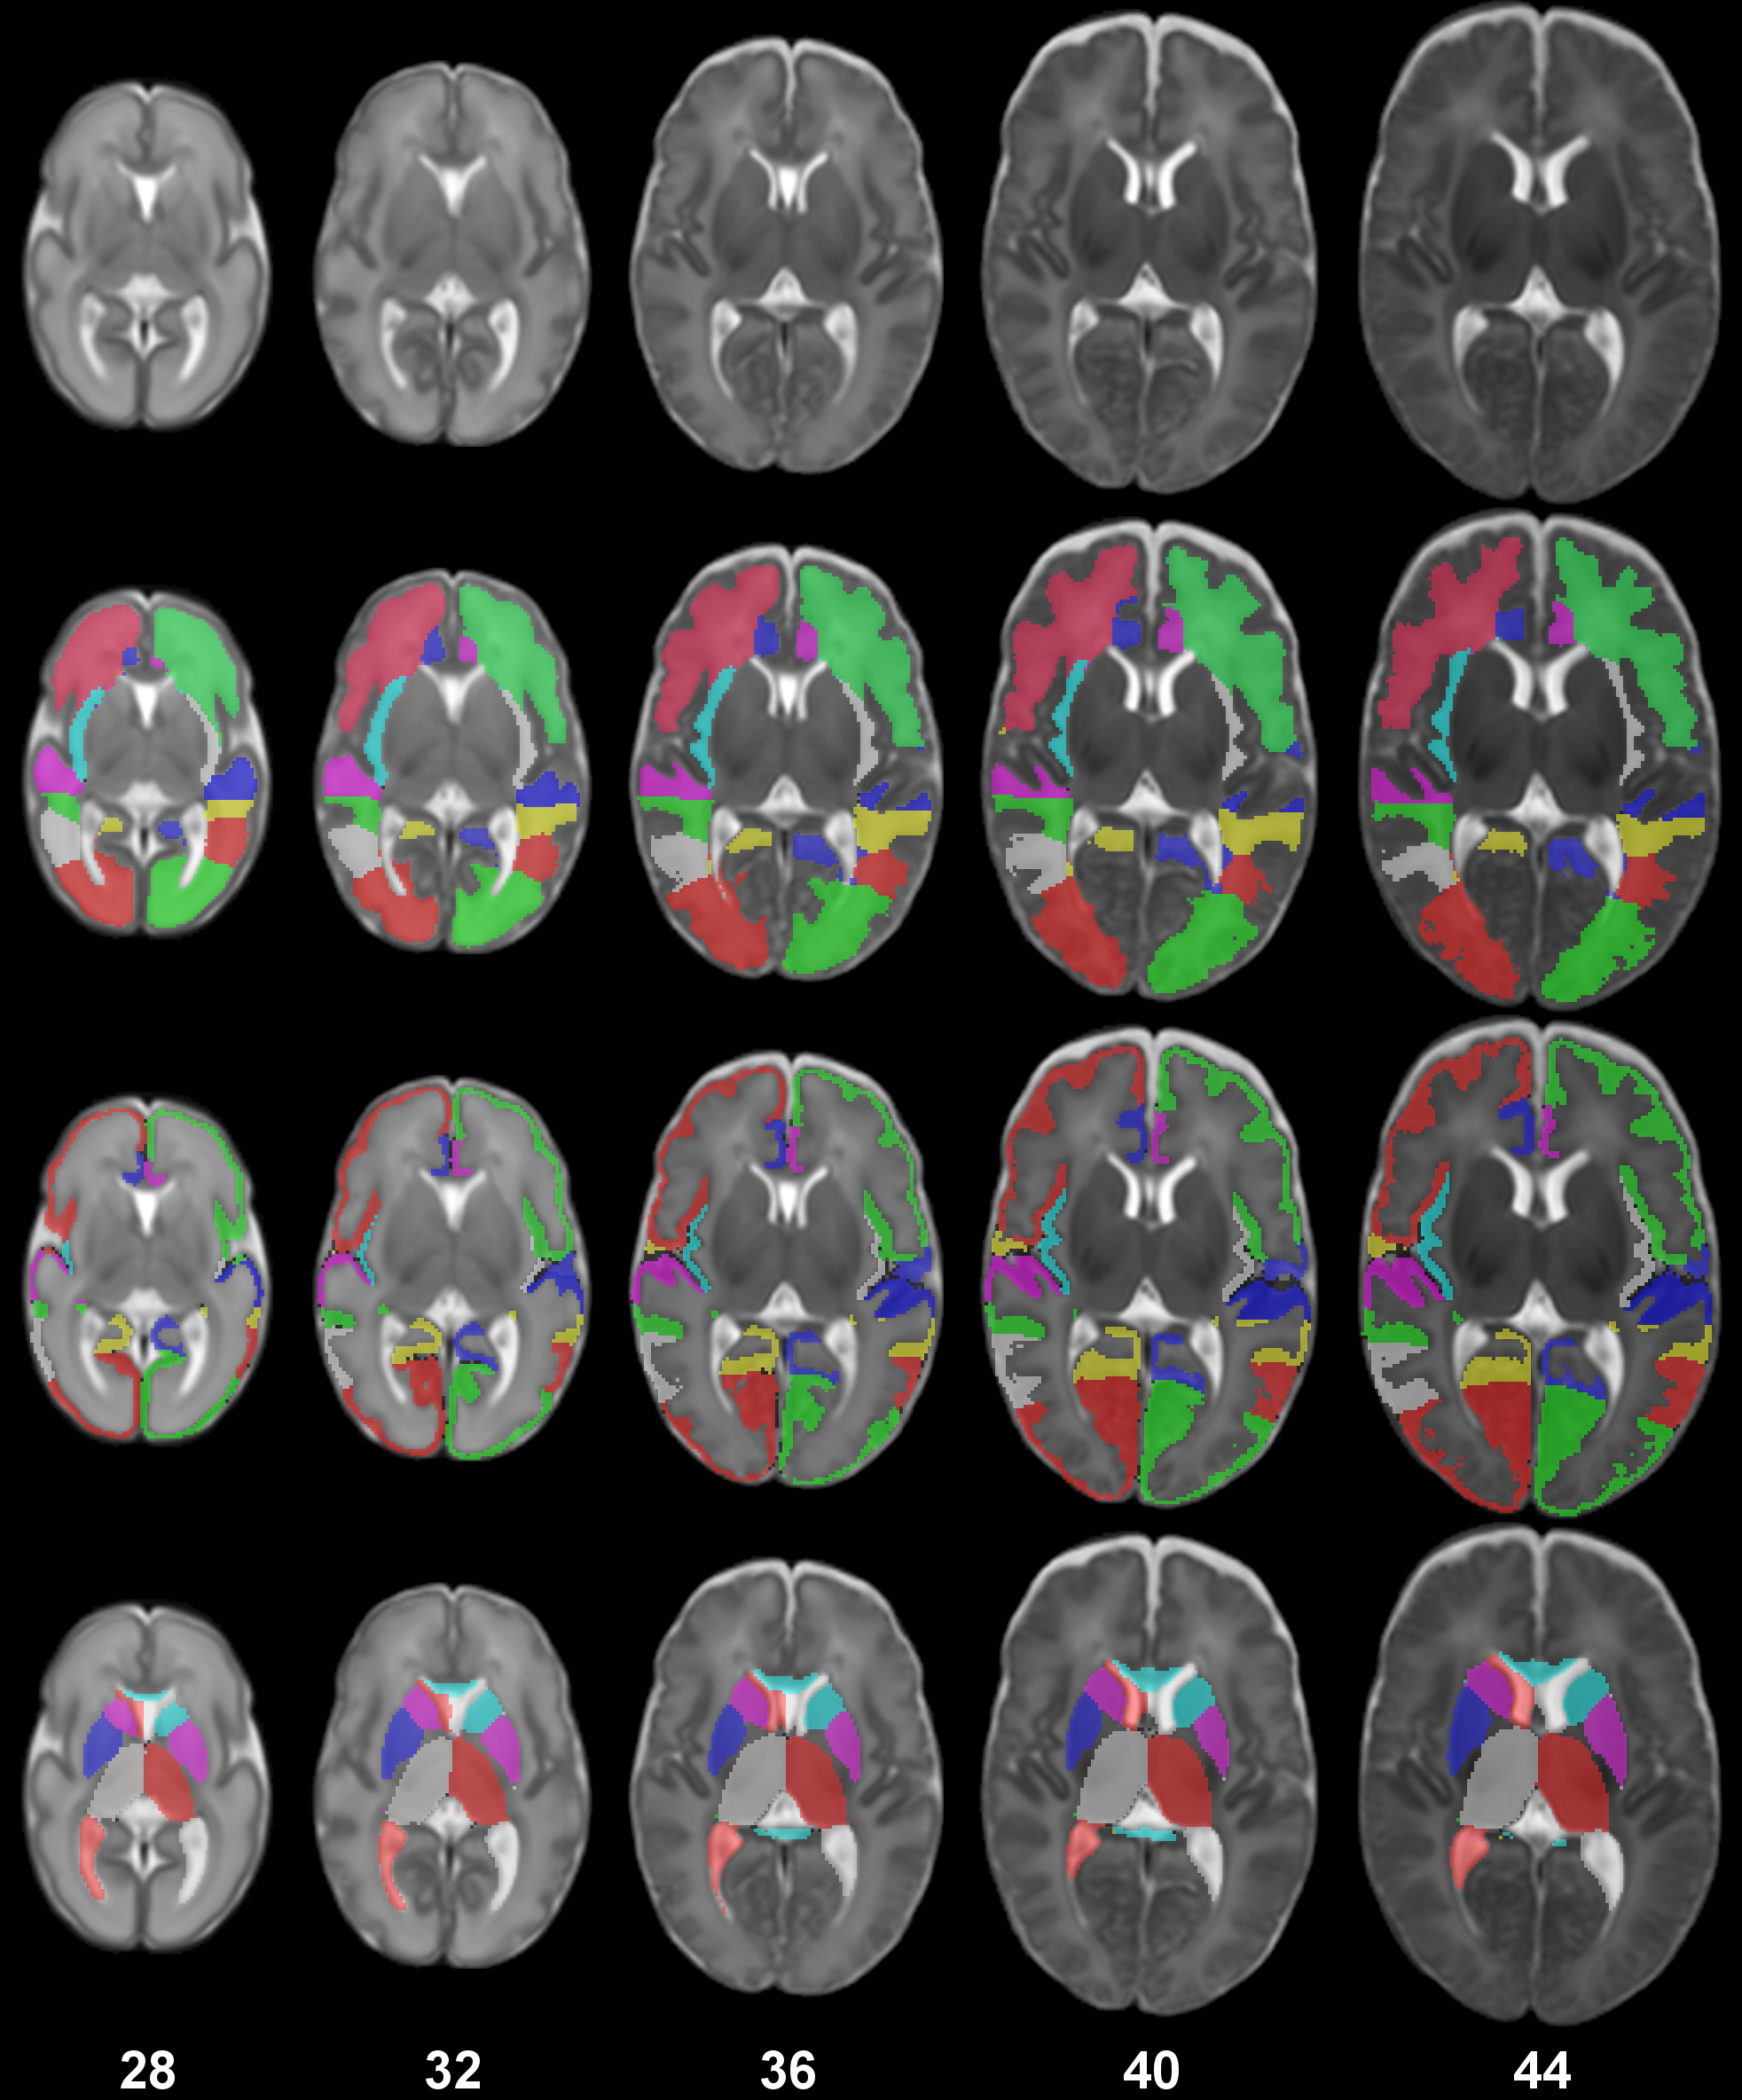
 We have constructed a detailed spatio-temporal structural atlas for the neonatal brain with 87 labelled structures of the developing brain. The atlas was constructed using automatic segmentations of 420 brain MR images. The segmentations were propagated to the coordinate space of Serag et al. (2012) and averaged with an age kernel at each timepoint to create the 4D atlas.
The structural atlas defines the structure probability and average segmentation of each structure. The atlases by Gousias et al. (ALBERTs) were used as prior knowledge for the segmentation and were further augmented to provide differentiation between gray and white matter.
The probability of the different structures of the brain can be viewed using the viewer below.
Download
The probabilistic and maximum-probability templates are only included in the download. The T1 and T2 templates can be downloaded from here.
Materials
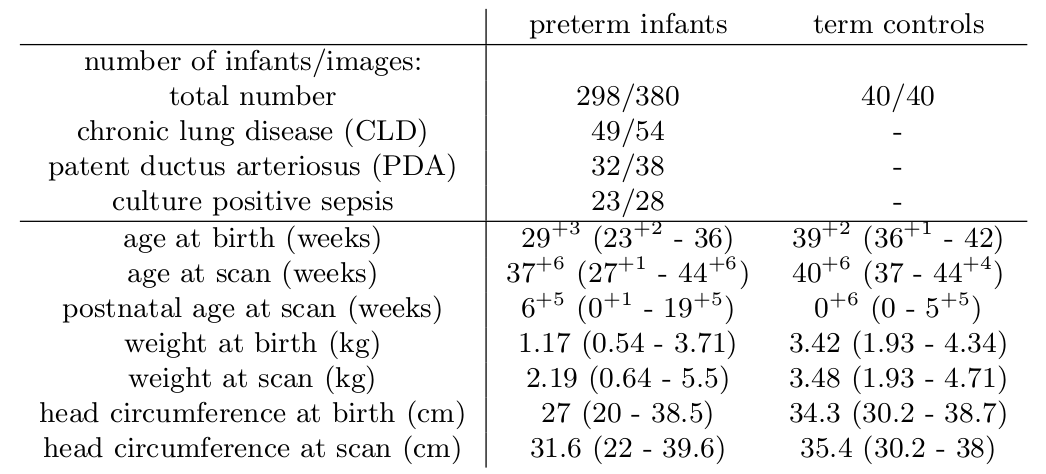
The characteristics of the cohort used to construct this atlas are presented in the table below.
Methods
The atlas construction is described in detail in:
- Antonios Makropoulos, Paul Aljabar, Robert Wright, Britta Huning, Nazakat Merchant, Tomoki Arichi, Nora Tusor, Joseph V. Hajnal, A. David Edwards, Serena J. Counsell, Daniel Rueckert. Regional growth and atlasing of the developing human brain, NeuroImage 125: 456–478, 2015 (Link to paper from publisher).
A few improvements have been performed to the atlas created from the study.
Viewer
The viewer displays the probability maps of the different structures of the brain. It uses the Papaya viewer.